java性能工具
1 | 性能工具: |
jvm内存快照dump文件太大,怎么分析
1、场景
通常,使用eclipse的mat图形化工具打开dump的时候都会内存溢出.
对于比较小的dump,eclipse可以打开,但一旦dump文件太大,eclipse就有点束手无策。
这时候怎么办呢?可以使用linux下的mat,既Memory Analyzer Tools
2、dump生成
dump可以是内存溢出时让其自动生成,或者手工直接导。配置jvm参数-XX:+HeapDumpOnOutOfMemoryError -XX:HeapDumpPath=/home/biapp/m.hprof
手工直接导,PID为进程号
jmap -dump:live,format=b,file=m.hprof PID
3、准备工作,下载LINUX的MAT
地址:http://www.eclipse.org/mat/downloads.php
在linux服务器执行命令 uname –m查看版本

下载对应的版本
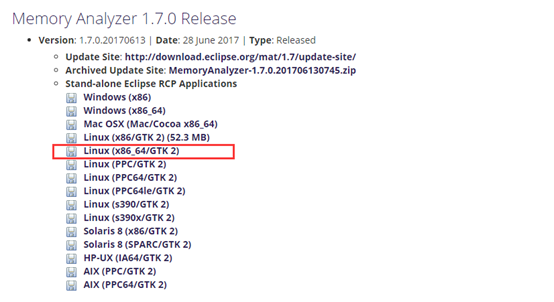
下载后将包传到linux服务器上解压。

MemoryAnalyzer.ini 配置文件可以修改最大的内存,默认1G基本够用了。
4、在linux执行分析命令
执行命令
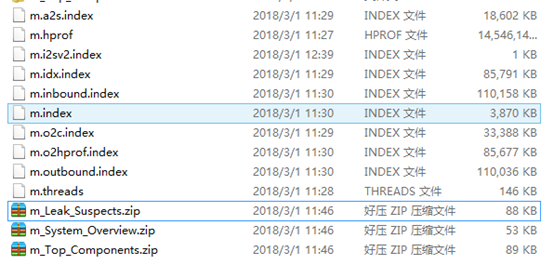
./ParseHeapDump.sh m.hprof org.eclipse.mat.api:suspects org.eclipse.mat.api:overview org.eclipse.mat.api:top_components。
m.hprof就是jvm的dump文件,在mat目录下会生成3份.zip结尾的报告和一些m.相关的文件,将生成的m.hprof相关的文件都下载到windows本地磁盘。
如:
5、打开分析报告
1)使用浏览器
解压缩以.zip结尾的文件,解压后
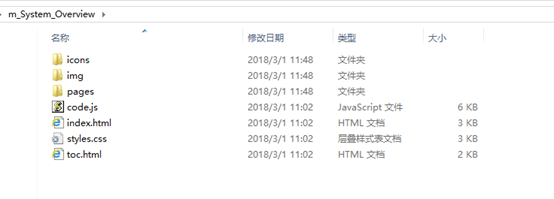
使用浏览器打开index.html文件内容,查看分析报告
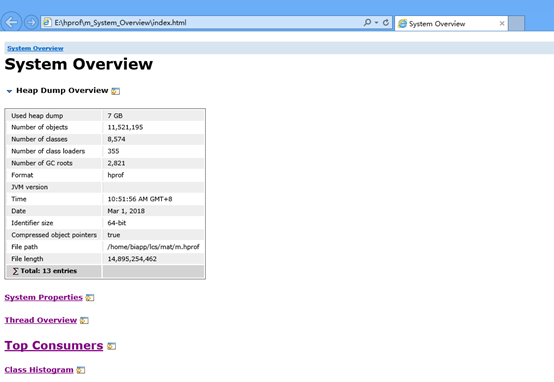
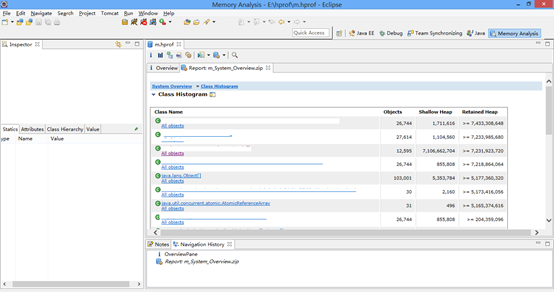
查看Class Histogram一项
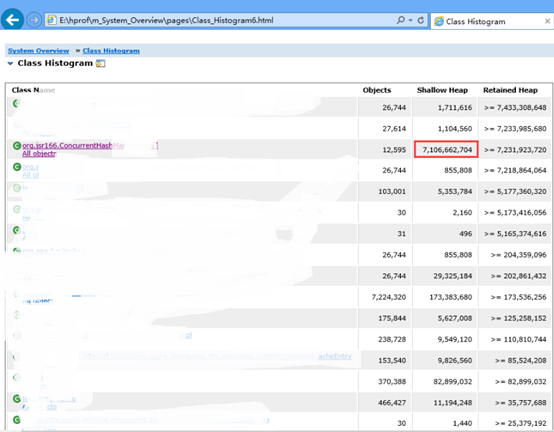
发现其中一个类对象占用了7个G,这里的Heap单位都是Byte,自行换算。
Shallow Heap 既对象本身的大小
Retained Heap 对象自身加起直接或间接引用的大小
2)使用eclipse的mat工具
Eclipse需要按照mat工具,安装步骤可以百度,或者参考
https://jingyan.baidu.com/article/cb5d61053562ed005c2fe022.html
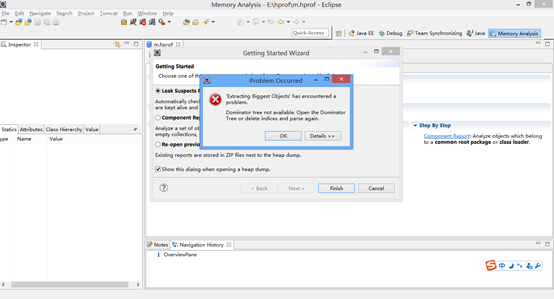
如果直接打开dump文件还是会内存溢出,所以可以使用eclipse打开分析报告即可。
使用eclipse-File-Open File打开dump文件,如下:
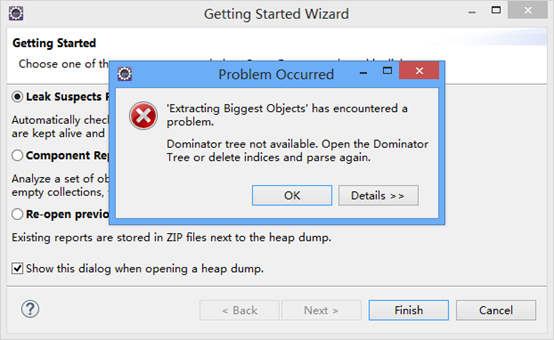
会提示错误,点击OK忽略错误,然后选择第三项,重新打开之前的运行报告
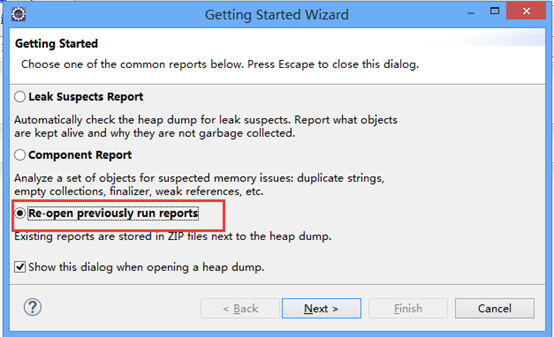
点击Next,出现如下界面
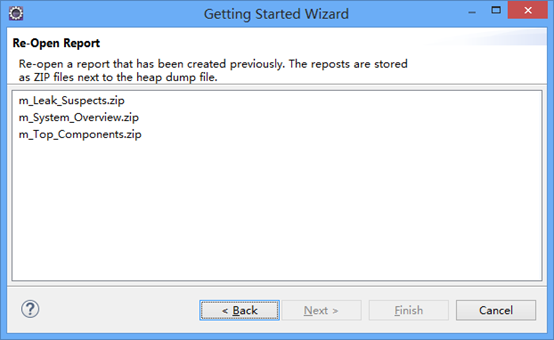
选择其中的一份报告打开,如m_System_Overview.zip
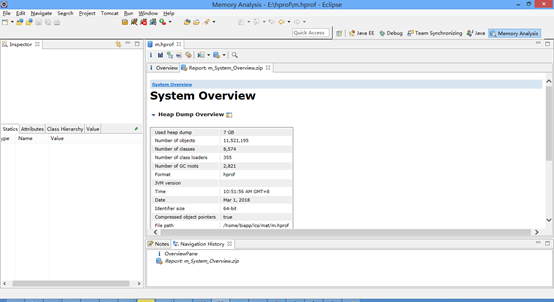
得到相同的结果
G1GC 概念与性能调优 (jdk11)
本文不讨论 G1 底层数据结构与算法, 从 G1 GC 行为上做简要介绍 G1 的过程
Garbage-First Garbage Collector 从官网的描述来看 G1 is a generational, incremental, parallel, mostly concurrent, stop-the-world, and evacuating garbage collector which monitors pause-time goals in each of the stop-the-world pauses. Similar to other collectors, G1 splits the heap into (virtual) young and old generations. Space-reclamation efforts concentrate on the young generation where it is most efficient to do so, with occasional space-reclamation in the old generation
从介绍可以加粗几个重点
- 分代
- 并发
- STW
- 在每个STW阶段关注暂停时间目标
- 回收主要集中在最有效的young generation, old generation则没这么频繁
在G1中, 为了提升吞吐量, 有一些操作永远是(STW) stop-the-world 的. 其他的一些要长期的, 如全局标记这种要全堆进行的操作与应用程序并发进行. 为了让空间回收的 STW 尽可能减少, G1并行的分步的递增进行空间回收. G1通过追踪此前应用行为和垃圾回收停顿的信息来构建一个与开销有关的模型(Pause Prediction Model). 它使用这些信息停顿期间可做的工作. 举个例子, G1首先回收最高效的区域(也即垃圾最满的区域, 因此称为垃圾-优先).
堆
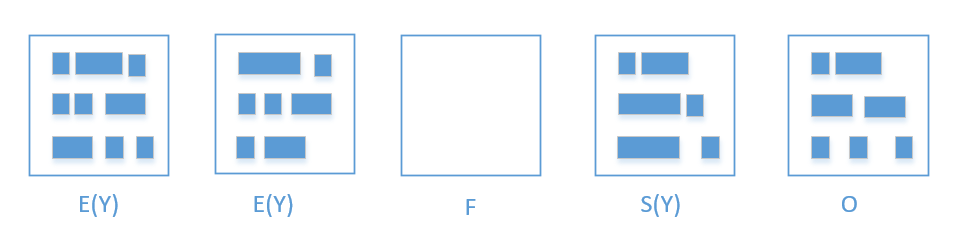
G1把堆分成了n个大小相同的region

- E 是 eden region
- S 是 survivor region
- O 是 old region
- H 是 humongous (老年代可以是 humongous, 可以看出, 他可以跨越多个连续regions. 直接分配到老年代, 防止反复拷贝移动)
Java 9 以后开启的参数
自从 Java9 后, 引入的统一的日志, 也就是 Xlog 参数. 下面是建议的 GCLog 参数
1 | -Xlog:gc*:file=your.log:tags,time,uptime,level:filecount=5,filesize=100m |
G1 的 GC 阶段
我们明白, 调优的基本步骤就是
- Measure 收集相关诊断信息 (例如, 收集详细的gclog, 默认log level info 可以满足大部分情况)
- Understand 理解发生了什么
- Tune 调优
只有明白了GC内部发生了什么, 才能针对性的对其进行调整
下面通过一些正常的 GC log 来理解 GC 的三种方式 GC 做了什么
Young Only Phase
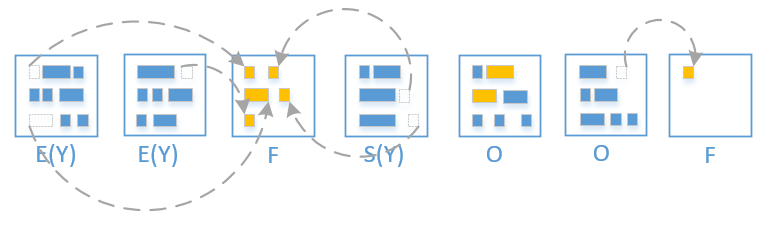
先用张图来简单理解 Young GC 过程
- 垃圾回收的过程就是 Allocated->eden; eden -> survivor; survivor -> survivor; survivor -> old;
- 可以看到, 这里有 eden, survivor, old 还有个 free region.
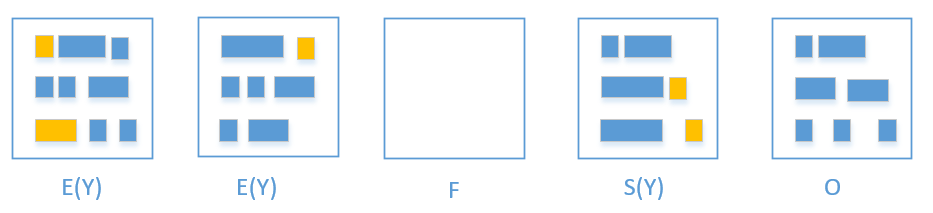
- 橙色就是活着的对象
- G1会把橙色对象拷贝到free region
- 当拷贝完毕, free region 就会晋升为 survivor region, 以前的 eden 就被释放了
- 如果 Young gc 中, 花费了大量的时间
- 正常来说, 大部分在 Young 的对象都不会存活很长时间
- 如果不符合这个规则 (大部分在 Young 的对象都不会存活很长时间), 你可能需要调整一下 Young 区域占比, 来降低 Young 对象的拷贝时间
-XX:G1NewSizePercent(默认:5) Young region 最小值-XX:G1MaxNewSizePercent(默认: 60) Young region 最大值
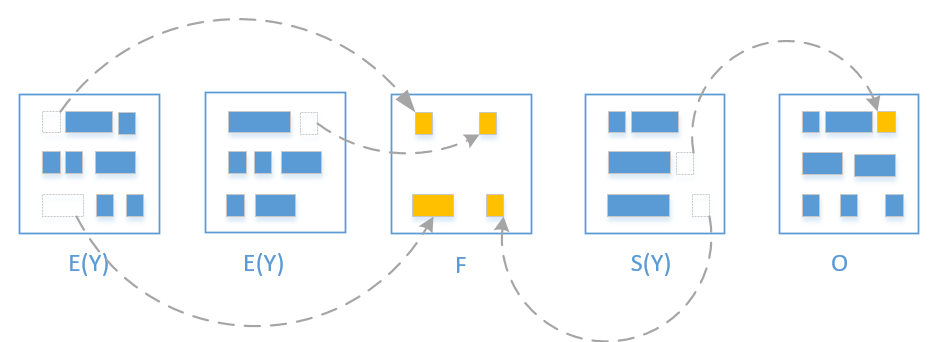
Mixed gc Phase
- Mixed gc 会选取所有的 Young region + 收益高的若干个 Old region.
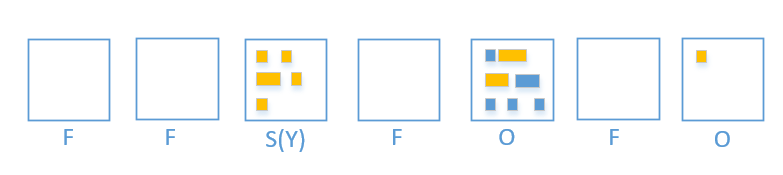
同样的, 被回收的 region 就变回 free region 了
从上图可以了解到 Mixed gc 只能回收部分的老年代
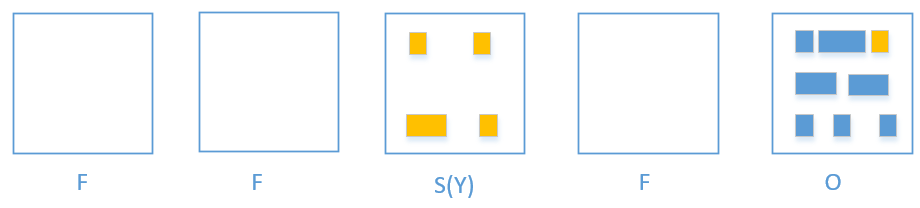
G1 是如何选择要回收的 regions 的?
-XX:G1MaxNewSizePercent与 Young 关联-XX:MixedGCCountTarget与 old 关联
-XX:MixedGCCountTarget1
2
3
4
5
6
7
8
9
10
11
12
13
14
15
16
17
18
19
20
21
22
23
24
25
26
27
28
29
30
31
32
33
34
35
36
37
38
39
40
41
42
43
44
45
46
47
48
49
50
51
52
53
54
55
56
57
58
59
60
61
62
63
64
65
66
67
68
69
70
71
72
73
74
75
76
77
78
79
80
81
82
83
84
85
86
87
88
89
90
91
92
93
94
95
96
97
98
99
100
101
102
103
104
105
106
107
108
109
110
111
112
113
114
115
116
117
118
119
120
121
122
123
124
125
126
127
128
129
130
131
132
133
134
135
136
137
138
139
140
默认是8, 意味着要在8次以内回收完所有的 old region
- 换句话说, 如果你有 800 个 old region, 那么一次 mixed gc 最大会回收 100 个 old region
- G1 也可以被调整成不做这么多工作, 也就是回收少点, 浪费堆内存, 导致更堆使用
- `-XX:G1MixedGCLiveThresholdPercent` (默认:85) 可能会提高堆使用率
- `-XX:G1HeapWastePercent` (默认:5) 如果可回收低于这个值, 那么将不会启动Mixed gc
### Full gc Phase
- Full gc 是不应该发生的
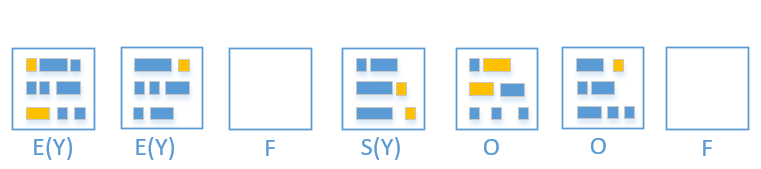
### 先来看看 GC 周期
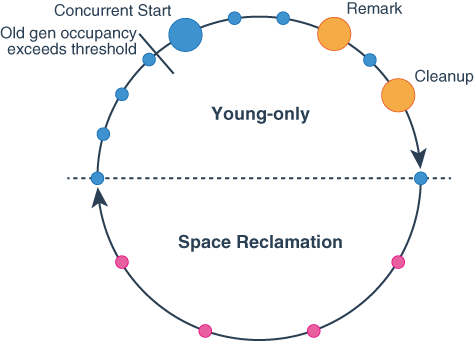
G1 有两个阶段, 它会在这两个阶段往返, 分别是 Young-only, Space Reclamation.
- Young-only 包含一系列逐渐填满 old gen 的 gc
- Space Reclamation G1 会递进地回收 old gen 的空间, 同时也处理 Young region
图是来自 oracle 上对 gc 周期的描述, 实心圆都表示一次 GC 停顿
- 蓝色 Young-only
- 黄色 标记过程的停顿
- 红色 Mixed gc 停顿
在几次gc后, old gen 的对象占有比超过了 `InitiatingHeapOccupancyPercent`, gc就会进入并发标记准备(concurrent mark).
- G1 在每一次 Young 回收中都会查找活对象(有引用的对象)
- G1 在 old region 并发查找活对象
- 叫 concurrent marking
- 可能花费很长时间
- 不会停止 Java 应用
- G1 没有活对象的引用信息是不能进行垃圾回收的
- Mixed gc 依赖 concurrent mark
回到 full gc, 从上面简单分析得出, full gc 发生是没有足够的 free region, 如果堆是足够大的, Mixed gc 没有回收足够的 old region, 或者 concurrent mark 没法及时完成, 都可能会导致 full gc.
### gc 日志
```log
[gc,start ] GC(78) Pause Young (Normal) (G1 Evacuation Pause)
[gc,task ] GC(78) Using 10 workers of 10 for evacuation
[gc,phases ] GC(78) Pre Evacuate Collection Set: 3.2ms
[gc,phases ] GC(78) Evacuate Collection Set: 28.8ms
[gc,phases ] GC(78) Post Evacuate Collection Set: 1.8ms
[gc,phases ] GC(78) Other: 1.1ms
[gc,heap ] GC(78) Eden regions: 538->0(871)
[gc,heap ] GC(78) Survivor regions: 69->33(76)
[gc,heap ] GC(78) Old regions: 1041->1077
[gc,heap ] GC(78) Humongous regions: 3->1
[gc,metaspace ] GC(78) Metaspace: 71777K->71777K(1114112K)
[gc ] GC(78) Pause Young (Normal) (G1 Evacuation Pause) 3300M->2220M(6144M) 34.907ms
[gc,cpu ] GC(78) User=0.24s Sys=0.05s Real=0.04s
[gc,start ] GC(79) Pause Young (Concurrent Start) (G1 Humongous Allocation)
[gc,task ] GC(79) Using 10 workers of 10 for evacuation
[gc,phases ] GC(79) Pre Evacuate Collection Set: 0.2ms
[gc,phases ] GC(79) Evacuate Collection Set: 22.3ms
[gc,phases ] GC(79) Post Evacuate Collection Set: 0.9ms
[gc,phases ] GC(79) Other: 1.8ms
[gc,heap ] GC(79) Eden regions: 569->0(656)
[gc,heap ] GC(79) Survivor regions: 33->55(113)
[gc,heap ] GC(79) Old regions: 1077->1077
[gc,heap ] GC(79) Humongous regions: 1->1
[gc,metaspace ] GC(79) Metaspace: 71780K->71780K(1114112K)
[gc ] GC(79) Pause Young (Concurrent Start) (G1 Humongous Allocation) 3357M->2264M(6144M) 25.305ms
[gc,cpu ] GC(79) User=0.21s Sys=0.00s Real=0.03s
[gc ] GC(80) Concurrent Cycle
[gc,marking ] GC(80) Concurrent Clear Claimed Marks
[gc,marking ] GC(80) Concurrent Clear Claimed Marks 0.147ms
[gc,marking ] GC(80) Concurrent Scan Root Regions
[gc,marking ] GC(80) Concurrent Scan Root Regions 16.125ms
[gc,marking ] GC(80) Concurrent Mark (373.358s)
[gc,marking ] GC(80) Concurrent Mark From Roots
[gc,task ] GC(80) Using 4 workers of 4 for marking
[gc,marking ] GC(80) Concurrent Mark From Roots 57.029ms
[gc,marking ] GC(80) Concurrent Preclean
[gc,marking ] GC(80) Concurrent Preclean 0.454ms
[gc,marking ] GC(80) Concurrent Mark (373.358s, 373.415s) 57.548ms
[gc,start ] GC(80) Pause Remark
[gc,stringtable] GC(80) Cleaned string and symbol table, strings: 36361 processed, 315 removed, symbols: 192117 processed, 500 removed
[gc ] GC(80) Pause Remark 2326M->956M(6144M) 14.454ms
[gc,cpu ] GC(80) User=0.08s Sys=0.03s Real=0.02s
[gc,marking ] GC(80) Concurrent Rebuild Remembered Sets
[gc,marking ] GC(80) Concurrent Rebuild Remembered Sets 38.843ms
[gc,start ] GC(80) Pause Cleanup
[gc ] GC(80) Pause Cleanup 974M->974M(6144M) 0.660ms
[gc,cpu ] GC(80) User=0.00s Sys=0.00s Real=0.00s
[gc,marking ] GC(80) Concurrent Cleanup for Next Mark
[gc,marking ] GC(80) Concurrent Cleanup for Next Mark 16.673ms
[gc ] GC(80) Concurrent Cycle 146.748ms
[gc,start ] GC(81) Pause Young (Prepare Mixed) (G1 Evacuation Pause)
[gc,task ] GC(81) Using 10 workers of 10 for evacuation
[gc,mmu ] GC(81) MMU target violated: 61.0ms (60.0ms/61.0ms)
[gc,phases ] GC(81) Pre Evacuate Collection Set: 0.1ms
[gc,phases ] GC(81) Evacuate Collection Set: 76.8ms
[gc,phases ] GC(81) Post Evacuate Collection Set: 0.9ms
[gc,phases ] GC(81) Other: 1.1ms
[gc,heap ] GC(81) Eden regions: 211->0(136)
[gc,heap ] GC(81) Survivor regions: 55->17(34)
[gc,heap ] GC(81) Old regions: 392->443
[gc,heap ] GC(81) Humongous regions: 3->1
[gc,metaspace ] GC(81) Metaspace: 71780K->71780K(1114112K)
[gc ] GC(81) Pause Young (Prepare Mixed) (G1 Evacuation Pause) 1320M->919M(6144M) 78.857ms
[gc,cpu ] GC(81) User=0.41s Sys=0.37s Real=0.08s
[gc,start ] GC(82) Pause Young (Mixed) (G1 Evacuation Pause)
[gc,task ] GC(82) Using 10 workers of 10 for evacuation
[gc,phases ] GC(82) Pre Evacuate Collection Set: 0.1ms
[gc,phases ] GC(82) Evacuate Collection Set: 22.1ms
[gc,phases ] GC(82) Post Evacuate Collection Set: 0.8ms
[gc,phases ] GC(82) Other: 0.9ms
[gc,heap ] GC(82) Eden regions: 136->0(142)
[gc,heap ] GC(82) Survivor regions: 17->11(20)
[gc,heap ] GC(82) Old regions: 443->367
[gc,heap ] GC(82) Humongous regions: 1->1
[gc,metaspace ] GC(82) Metaspace: 71780K->71780K(1114112K)
[gc ] GC(82) Pause Young (Mixed) (G1 Evacuation Pause) 1191M->757M(6144M) 23.970ms
[gc,cpu ] GC(82) User=0.15s Sys=0.08s Real=0.03s
[gc,start ] GC(83) Pause Young (Mixed) (G1 Evacuation Pause)
[gc,task ] GC(83) Using 10 workers of 10 for evacuation
[gc,phases ] GC(83) Pre Evacuate Collection Set: 0.1ms
[gc,phases ] GC(83) Evacuate Collection Set: 5.0ms
[gc,phases ] GC(83) Post Evacuate Collection Set: 0.8ms
[gc,phases ] GC(83) Other: 1.1ms
[gc,heap ] GC(83) Eden regions: 142->0(783)
[gc,heap ] GC(83) Survivor regions: 11->10(20)
[gc,heap ] GC(83) Old regions: 367->294
[gc,heap ] GC(83) Humongous regions: 1->1
[gc,metaspace ] GC(83) Metaspace: 71780K->71780K(1114112K)
上面是连续几次GC的日志, 可以对照着 gc 周期来看 为了方便排版, 把时间相关的tag给精简掉了
- GC(78) 是一次普通的young gc, 里面信息有各种 region 的变化
- 这里简单说一下 humongous 对象的处理
- humongous 对象在G1中是被特殊对待的, G1 只决定它们是否生存, 回收他们占用的空间, 从不会移动它们.
- Young-Only 阶段, humongous regions 可能会被回收
- Space-Reclamation, humongous regions 可能会被回收
- GC(79) 开始进入并发阶段
- GC(80) 完成了 Cleanup, 紧接着一个 Prepare Mixed GC(81) 的垃圾收集, 对应周期虚线右边的蓝实心圆
- GC(82) 之后就是 Space Reclamation 阶段了. 多个 Mixed GC 会进行
根据日志, 可以简单看到每个步骤花费的时间, 以及对应区域垃圾的回收情况, 结合GC参数, 可以定位出什么问题, 针对性的调整参数.
吞吐量跟低延时是无法兼得的, 低延时意味着GC工作会更加频繁, 相对的, 会占用应用的资源, 吞吐量降低. 需要大吞吐量, 那么GC工作就会减少, 相对的, 每次回收的垃圾就会多, 暂停时间就会增加, 延时就会增加.
-XX:MaxGCPauseMillisG1 会尽量满足这个参数设定的目标时间, 通过此参数可以平衡应用需要的吞吐量以及延时.
g1gc young shrinking
1 | [gc,start ] GC(29233) Pause Young (Normal) (G1 Evacuation Pause) |
- Eden regions shrinking 1771 -> 84
- If not otherwise constrained, then G1 adaptively sizes the young generation size between the values that -XX:G1NewSizePercent and -XX:G1MaxNewSizePercent determine to meet pause-time. See Garbage-First Garbage Collector Tuning for more information about how to fix long pauses.
- User=0.22s Sys=0.00s Real=0.90s, Real > User + Sys
- gc lack of cpu time
从 GC log 了解与分析 gc
CMS 介绍
CMS, Concurrent Mark Sweep, 并发的标记清楚算法GC.
CMS 执行
- 初始化标记
- 并发标记
- 并发预清理
- 重标记
- 并发清理
- 重置
环境配置是 JDK8, HotSpot VM
应用配置的参数
1 | -XX:+UseConcMarkSweepGC // 使用 CMS GC |
CMS GC log 如下
1 | // initial mark stop-the-world |
知识点
CMS 阶段
| 步骤 | 解释 | stop-the-world |
|---|---|---|
| CMS Initial Mark | 可达性分析, 标记 GC Roots 直接关联 对象 |
True |
| CMS-concurrent-mark | GC Tracing, 从 GC Roots 开始对堆进行可达性分析, 找出存活对象 |
False |
| CMS-concurrent-preclean | 负责前一个阶段标记了又发生改变的对象标记 | False |
| CMS-concurrent-abortable-preclean | 尝试着去承担 Final Remark 阶段足够多的工作, 重复的做相同的事情直到 abort 条件 | False |
| CMS Final Remark | 完成标记整个年老代的所有的存活对象 | True |
| CMS-concurrent-sweep | 开始移除对象 | False |
| CMS-concurrent-reset | 重置 CMS 算法内部结构 | False |
GC 触发条件
| 原因 | 说明 |
|---|---|
| Allocation Failure | 新生代(Young generation)不够空间给创建新对象, 触发 minor gc. |
| Promotion Failure | 没有 连续 的空间来存放更大的对象. 通常会导致 FGC. |
| GCLocker Initiated GC | JNI 临界区被释放就会触发 |
| Concurrent Mode Failure | CMS 采用多个线程和应用线程并发执行, 减少停顿时间, 通常发生于年老代被用完之前不能完成对无引用对象的回收或者年老代不能满足新的空间分配 |
| Heap Dump Initiated GC | heap dump 之前进行 FGC , 一般是通过工具 dump 会触发 (jmap) |
GC 异常点
通过 gceasy.io 上传日志, 分析异常点得出
1 | It looks like your application is waiting due to lack of compute resources (either CPU or I/O cycles). Serious production applications shouldn't be stranded because of compute resources. In 47 GC event(s), 'real' time took more than 'usr' + 'sys' time. |
| Timestamp | User Time (secs) | Sys Time (secs) | Real Time (secs) |
|---|---|---|---|
| 2018-08-06T10:21:12 | 0.26 | 0.01 | 0.61 |
| 2018-08-06T10:21:18 | 0.24 | 0.04 | 0.9 |
| 2018-08-06T10:33:25 | 0.22 | 0.01 | 0.58 |
| 2018-08-06T10:34:54 | 0.3 | 0.01 | 0.52 |
| 2018-08-06T10:35:15 | 0.55 | 0.02 | 1.15 |
意思就是 ‘real’ time > ‘usr’ + ‘sys’, 造成这种现象的可能性有
- Heavy I/O 如果有 I/O 密集任务, ‘real time’ 会变长. > 解决方案 1. 优化高 I/O 任务 1. 在服务器上减少导致高 I/O 的任务 1. 迁移应用到低 I/O 的服务器上
- Lack of CPU 如果是服务器上有多个进程在跑, 程序得不到足够的 CPU 周期, 就会开始等待. 因此 ‘real time’会变长 > 解决方案: 1. 减少服务器上的进程 1. 增加 CPU 1. 迁移应用到充足 CPU 服务器上
现象分析
当时出现的现象是: 1. CPU 告警 1. 上去服务器看到系统负载已经到70左右 1. top 信息看到应用占用 CPU 高 1. GC 日志显示同一台服务器上的两个服务在10点时间段 CMS 都在工作 1. 业务高峰期 1. 4核服务器
初步分析: 1. 从应用线程dump分析, 应用内线程无明显异常现象. 1. 结合 top -H 初步得到是 GC 线程在运行 1. 从 GC log 入手, 分析得出异常点, 回顾与计算两个服务 CMS 线程占用了一半的 CPU 资源 (4+3)/4*2, 导致 CPU 资源紧缺, 整体服务变慢.
参考4资料
1 | https://www.cnblogs.com/zhangxiaoguang/p/5792468.html |
linux性能监控
CPU、Memory、IO、Network等指标的讲解
一、CPU
1、良好状态指标
1 | - CPU利用率:User Time <= 70%,System Time <= 35%,User Time + System Time <= 70%。 |
2、监控工具
vmstat
1
2
3
4
5
6
7
8
9
10
11
12
13
14
15
16
17
18
19
20
21vmstat 1
procs -----------memory---------- ---swap-- -----io---- --system-- -----cpu------
r b swpd free buff cache si so bi bo in cs us sy id wa st
14 0 140 2904316 341912 3952308 0 0 0 460 1106 9593 36 64 1 0 0
17 0 140 2903492 341912 3951780 0 0 0 0 1037 9614 35 65 1 0 0
20 0 140 2902016 341912 3952000 0 0 0 0 1046 9739 35 64 1 0 0
17 0 140 2903904 341912 3951888 0 0 0 76 1044 9879 37 63 0 0 0
16 0 140 2904580 341912 3952108 0 0 0 0 1055 9808 34 65 1 0 0
重要参数:
r,run queue,可运行队列的线程数,这些线程都是可运行状态,只不过CPU暂时不可用;
b,被blocked的进程数,正在等待IO请求;
in,interrupts,被处理过的中断数
cs,context switch,系统上正在做上下文切换的数目
us,用户占用CPU的百分比
sys,内核和中断占用CPU的百分比
id,CPU完全空闲的百分比
上例可得:
sy高us低,以及高频度的上下文切换(cs),说明应用程序进行了大量的系统调用;
这台4核机器的r应该在12个以内,现在r在14个线程以上,此时CPU负荷很重。
$查看某个进程占用的CPU资源
1
2
3
4
5
6
7
8
9$ while :; do ps -eo pid,ni,pri,pcpu,psr,comm | grep 'test_command'; sleep 1; done
PID NI PRI %CPU PSR COMMAND
28577 0 23 0.0 0 test_command
28578 0 23 0.0 3 test_command
28579 0 23 0.0 2 test_command
28581 0 23 0.0 2 test_command
28582 0 23 0.0 3 test_command
28659 0 23 0.0 0 test_command
……
二、Memory
1、良好状态指标
1 | - swap in (si) == 0,swap out (so) == 0 |
2、监控工具
vmstat
1
2
3
4
5
6
7
8
9
10
11
12
13
14
15
16
17
18
19$ vmstat 1
procs -----------memory---------- ---swap-- -----io---- --system-- -----cpu------
r b swpd free buff cache si so bi bo in cs us sy id wa st
0 3 252696 2432 268 7148 3604 2368 3608 2372 288 288 0 0 21 78 1
0 2 253484 2216 228 7104 5368 2976 5372 3036 930 519 0 0 0 100 0
0 1 259252 2616 128 6148 19784 18712 19784 18712 3821 1853 0 1 3 95 1
1 2 260008 2188 144 6824 11824 2584 12664 2584 1347 1174 14 0 0 86 0
2 1 262140 2964 128 5852 24912 17304 24952 17304 4737 2341 86 10 0 0 4
重要参数:
swpd,已使用的 SWAP 空间大小,KB 为单位;
free,可用的物理内存大小,KB 为单位;
buff,物理内存用来缓存读写操作的buffer大小,KB 为单位;
cache,物理内存用来缓存进程地址空间的 cache 大小,KB 为单位;
si,数据从 SWAP 读取到 RAM(swap in)的大小,KB 为单位;
so,数据从 RAM 写到 SWAP(swap out)的大小,KB 为单位。
上例可得:
物理可用内存 free 基本没什么显著变化,swapd逐步增加,说明最小可用的内存始终保持在 256MB(物理内存大小) * 10% = 2.56MB 左右,当脏页达到10%的时候就开始大量使用swap。
free
1
2
3
4
5$ free -m
total used free shared buffers cached
Mem: 8111 7185 926 0 243 6299
-/+ buffers/cache: 643 7468
Swap: 8189 0 8189
三、磁盘IO
1、良好状态指标
iowait % < 20%
1
2
3提高命中率的一个简单方式就是增大文件缓存区面积,缓存区越大预存的页面就越多,命中率也越高。
Linux 内核希望能尽可能产生次缺页中断(从文件缓存区读),并且能尽可能避免主缺页中断(从硬盘读),这样随着次缺页中断的增多,文件缓存区也逐步增大,直到系统只有少量可用物理内存的时候 Linux 才开始释放一些不用的页。
2、监控工具
查看物理内存和文件缓存情况
1
2
3
4
5
6$ cat /proc/meminfo
MemTotal: 8182776 kB
MemFree: 3053808 kB
Buffers: 342704 kB
Cached: 3972748 kB
这台服务器总共有 8GB 物理内存(MemTotal),3GB 左右可用内存(MemFree),343MB左右用来做磁盘缓存(Buffers),4GB左右用来做文件缓存区(Cached)。
sar
1
2
3
4
5
6
7
8
9
10
11
12
13
14
15
16
17$ sar -d 2 3
Linux 2.6.9-42.ELsmp (webserver) 11/30/2008 _i686_ (8 CPU)
11:09:33 PM DEV tps rd_sec/s wr_sec/s avgrq-sz avgqu-sz await svctm %util
11:09:35 PM dev8-0 0.00 0.00 0.00 0.00 0.00 0.00 0.00 0.00
11:09:35 PM DEV tps rd_sec/s wr_sec/s avgrq-sz avgqu-sz await svctm %util
11:09:37 PM dev8-0 1.00 0.00 12.00 12.00 0.00 0.00 0.00 0.00
11:09:37 PM DEV tps rd_sec/s wr_sec/s avgrq-sz avgqu-sz await svctm %util
11:09:39 PM dev8-0 1.99 0.00 47.76 24.00 0.00 0.50 0.25 0.05
Average: DEV tps rd_sec/s wr_sec/s avgrq-sz avgqu-sz await svctm %util
Average: dev8-0 1.00 0.00 19.97 20.00 0.00 0.33 0.17 0.02
重要参数:
await表示平均每次设备I/O操作的等待时间(以毫秒为单位)。
svctm表示平均每次设备I/O操作的服务时间(以毫秒为单位)。
%util表示一秒中有百分之几的时间用于I/O操作。
如果svctm的值与await很接近,表示几乎没有I/O等待,磁盘性能很好,如果await的值远高于svctm的值,则表示I/O队列等待太长,系统上运行的应用程序将变慢。
如果%util接近100%,表示磁盘产生的I/O请求太多,I/O系统已经满负荷的在工作,该磁盘可能存在瓶颈。
四、Network IO
对于UDP
1、良好状态指标
1 | 接收、发送缓冲区不长时间有等待处理的网络包 |
2、监控工具
- netstat
对于UDP服务,查看所有监听的UDP端口的网络情况
1 | $ watch netstat -lunp |
对于UDP服务,查看丢包情况(网卡收到了,但是应用层没有处理过来造成的丢包)
1 | $ watch netstat -su |
对于TCP(来自david的经验,thx~~)
1、良好状态指标
1 | 对于TCP而言,不会出现因为缓存不足而存在丢包的事,因为网络等其他原因,导致丢了包,协议层也会通过重传机制来保证丢的包到达对方。 |
2、监控工具
1 | # cat /proc/net/snmp | grep Tcp: |
CPU
1 | dstat –c 打印cpu |
内存
1 | 连接CPU和磁盘,放在内存速度快,规格DDR4 |
IO
1 | SATA,SAS,SSD(转的越快越好) |
带宽
1 | 命令:ethtool eth* |
其他
1 | 查看pci信息,即主板所有硬件槽信息。 |
1 | 手工释放Linux内存——/proc/sys/vm/drop_cache |
待整理
1 |
|
命令ss
1 | ss命令高级网络 |
wget
1 | wget命令用来从指定的URL下载文件。wget非常稳定,它在带宽很窄的情况下和不稳定网络中有很强的适应性,如果是由于网络的原因下载失败,wget会不断的尝试,直到整个文件下载完毕。如果是服务器打断下载过程,它会再次联到服务器上从停止的地方继续下载。这对从那些限定了链接时间的服务器上下载大文件非常有用。 |